
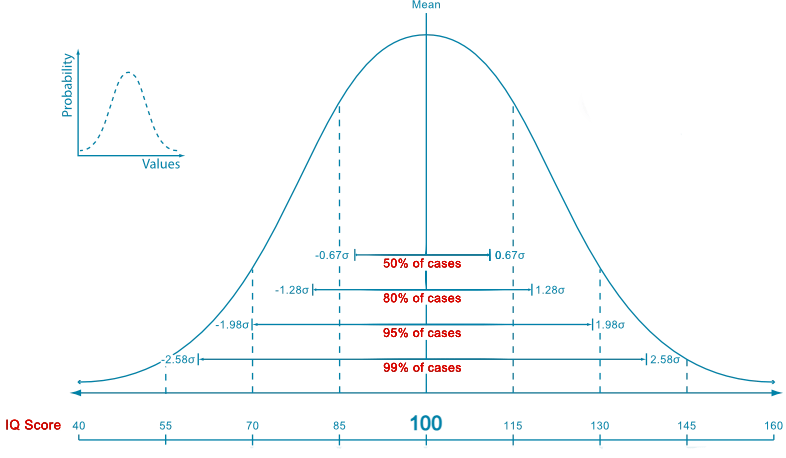
A normal distribution of data in an IQ test refers to the frequency distribution of IQ scores among a population. The distribution of IQ scores in a population often follows a bell-shaped curve, also known as a normal distribution.
In a normal distribution, the majority of scores fall in the middle range, with fewer scores at the extremes. In the case of IQ scores, this means that most people fall within the average range of 85 to 115, with fewer people at the very low and very high ends of the distribution.
The normal distribution of IQ scores has important implications for how we understand and interpret IQ test results. The distribution allows us to compare an individual’s IQ score to the scores of others in their age group and calculate a percentile rank. A percentile rank tells us what percentage of people in the population scored lower than the individual in question.
For example, if an individual has an IQ score of 130, this falls in the top 2.3% of the population. This means that only 2.3% of people in the population have a higher IQ score than this individual. Similarly, an IQ score of 70 would fall in the bottom 2.3% of the population.
The normal distribution of IQ scores is also important in understanding the concept of “giftedness.” Giftedness is often defined as having an IQ score in the top 2% of the population, which corresponds to a score of 130 or higher. This definition is based on the fact that only 2% of the population has an IQ score at or above this level.
It is worth noting that while the normal distribution of IQ scores is a useful statistical concept, it is not without limitations. For one, it assumes that the population being studied is large and diverse, and that IQ scores are normally distributed within that population. However, this may not be the case in all populations or contexts. Additionally, IQ tests have been criticized for being culturally biased and not taking into account individual differences in learning styles and abilities.
In conclusion, a normal distribution of data in an IQ test refers to the frequency distribution of IQ scores among a population. The normal distribution allows us to compare an individual’s IQ score to the scores of others in their age group and calculate a percentile rank. While the normal distribution of IQ scores is a useful statistical concept, it should be used in combination with other measures to get a more complete picture of a person’s abilities and potential.
Start now! Get your personal IQ score and share results with your friends!